Table of Contents
The Parseltongue Grimoire
Ionospheric Calibration
James M Anderson, 18 January 2006
Here are some scripts related to my Ionospheric Calibration work.
n05l2pt.py This file is being used to do the main calibration of my N05L2 EVN test observations for the ionosphere. It was developed before Cormac really began work on developing the ParselTongue EVN pipeline, so you should check out Cormac's stuff to see a more refined pipeline system for the EVN.
get_small_source_stats_main provides a function to get information about an image, similar to the verb IMSTAT in AIPS. It finds the peak and integrated brightness of a source (in Jy/beam and Jy), as well as the RMS level away from the source, ignoring edge pixels in the image.
Also of interest might be the function self_cal_source which provides a very basic self-calibration functionality. It is rather complex, so you will have to look at the code to see what is going on. SCMAP and similar tasks are already available with AIPS, but I have not found them to be very useful, and prefer to keep lots of control over the self-calibration process.
The main part of the software in this file is geared toward testing different ionospheric models, and therefore many operations such as phase referencing of sources are repeated over and over. You might have a look at process_phase_reference_data to see what is going on. This will also need the file n05l2pr.py.
The other work for the ionosphere involves creating a new AIPS table (AI) and putting ionospheric data into that table, and then moving the information to make a new CL table. A preliminary set of functions to do this can be found in albus_iono.py. Have a look at the apply_AI_table_to_CL_table function to see how to read from an old CL table and create a new one.
The EVN Pipeline
Stephen Bourke, 27 Aug 2010
The EVN pipeline was originally developed by Cormac Reynolds, it is currently being developed by Stephen Bourke.
The main pipeline script is evn.py. It uses three Python modules:
- evn_aips_tasks.py: Shortcut functions for executing AIPS tasks with most parameters defaulted to sensible values for the EVN. Parameters which must be set are mentioned in the docstring at the beginning, e.g., try
>>> help(evn_aips_tasks.runlwpla)
- evn_funcs.py: Other functions used by evn.py. Mostly provide simplified interaction with functions in evn_aips_tasks.py .
- crfuncs.py: Generic functions used by evn.py. At the moment this is just a couple of filehandling classes to allow better logging of what the pipeline is doing.
The pipeline is driven by an input file. An example can be found here: template.txt
If you want to grab it all in one go, here's a gzipped tar: pypeline-4.7.tar.gz
Usage
$ ParselTongue EVN.py template.txt
will run the pipeline using the given input file. A very brief guide to running the pipeline is available: pypeline_public.pdf. A description of the output of the pipeline is available at: http://www.evlbi.org/pipeline/pipe_desc.html. Any comments/questions on the pipeline should be directed to Stephen Bourke (bourke@jive.nl)
Miscellaneous
Calibrating narrow band data using solutions from wide band data
Huib Jan van Langevelde, 19 January 2006
The files mixedcal.py and snatch.py are a high level script and calibration routine which transfers wide band delay and phase solutions to narrow band data, by extrapolating to the proper frequency in the narrow band data.
The script linecal.py is a script to read specific data from the EVN archive and average it down in time, doing some standard calibration. It requires a file with metadata (el032com.txt).
Doing Fringe Rate Mapping in a different way
Huib Jan van Langevelde, 24 September 2009
ParselTongue exercise to implement fringe rate mapping in a different way, as discussed in a short memo.
Its main program is FrrMap.py, which comes along with HuibFrmapTasks.py, FrmapUtils.py, and Ea38Cl.py in this tar ball and you also need matplotlib.
UV coverage plot
from the ParselTongue Tutorial
It’s also possible to get at the actual visibilities in a UV data set. Here is a little script that uses matplotlib to make a UV coverage plot:
Plot of the phase for a single channel
from the ParselTongue Tutorial
And here is a script that makes a plot of the phase for a single channel on a randomly chosen baseline:
Plotting dynamic spectra of visibilities in a data set
Enno Middelberg, 16 July 2010
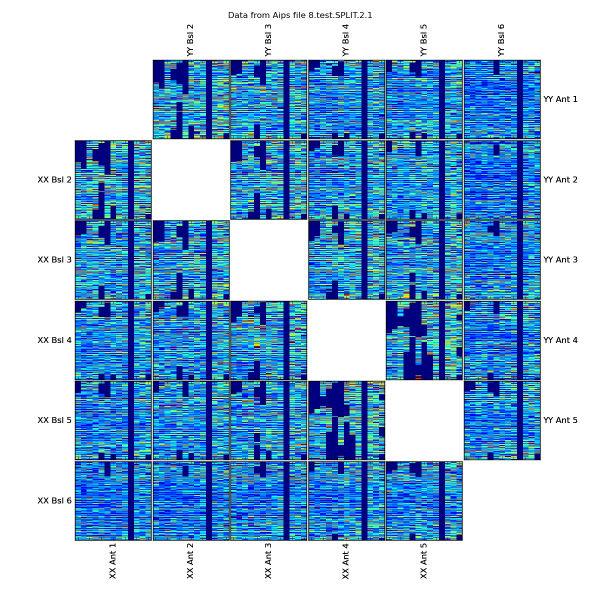
Here is a script that plots all visibilities in a data set as dynamic spectra on a single diagram. This lets one easily identify bad stations and baselines. Clicking on the subplots lets one zoom in on single baselines, and modified clicks (whils holding down shift keys etc) one can produce flagging commands suitable for Aips' UVFLG to flag baselines or antennas. It also handles multi-IF data. I have tested it on VLBA and GMRT data. It can be a bit slow, but this mostly depends on the number of baselines, not the size of the uv data. Brief instructions are printed to the terminal when called without command line options.
Here is an example:

